Waste Water in Municipalities
Municipal Wastewater Treatment
On the basis of the percentage of the population connected to the wastewater treatment systems and the treatment level in MWWTPs in 2007-2009, the theoretical load reduction potential that could be achieved by improved sewage treatment from the present levels compared to the HELCOM Recommendation levels was calculated for each Contracting Party. For Belarus, the reduction potential was estimated as the sum of nine major cities with a total of 1.59 million inhabitants, out of the four million inhabitants situated in the catchment area of the Baltic Sea.
Table 1. Municipal wastewater treatment plants of different size categories and their total connected loads expressed in population equivalent (PE). (Data sources: EU Member States – reporting on implementation of the Urban Waste Water Treatment Directive as of 31.12.2007; Russia – information in the draft National Implementation Programme for the HELCOM BSAP and the RusNIP Project (SEPA 2010); Belarus – information on WWTPs in the Baltic Sea catchment provided to HELCOM in 2008. Danish data from 2009 and additionally the MWWTPs there are 1% of PE as private wastewater treatment plants. Swedish data from 2008: Statistics Sweden 2010)
| country | ≤2,000 PE1 | | 2,001-10,000 PE | | 10,001-100,000 PE | | > 100,001 PE | | Total | |
| | plants | load | plants | load | plants | load | plants | load | number | load |
| Denmark | 404 | 166,600 | 230 | 597,100 | 149 | 2,417,500 | 37 | 3,786,700 | 426 | 6,960,000 |
| Estonia | 7 | 6,200 | 16 | 35,128 | 14 | 180,403 | 7 | 1,006,528 | 44 | 1,228,248 |
| Finland | 1 | 1,400 | 100 | 449,100 | 95 | 2,506,100 | 14 | 3,170,900 | 210 | 6,127,500 |
| Germany | 3 | 6,300 | 150 | 623,273 | 103 | 2,798,035 | 13 | 2,627,000 | 269 | 6,054,558 |
| Latvia | 64 | 33,400 | 31 | 42,322 | 31 | 407,543 | 6 | 955,815 | 132 | 1,439,105 |
| Lithuania | 17 | 15,000 | 30 | 66,300 | 36 | 512,700 | 9 | 1,691,000 | 92 | 2,285,00 |
| Poland | 118 | 151,500 | 668 | 3,387,893 | 494 | 15,199,018 | 84 | 22,427,336 | 1364 | 41,165,752 |
| Sweden | n.i.2 | n.i.2 | 278 | 785,600 | 170 | 3,211,300 | 19 | 4,270,400 | 467 | 8,267,400 |
| Russia | n.i.2 | n.i.2 | n.i.2 | n.i.2 | n.i.2 | n.i.2 | n.i.2 | n.i.2 | 361 | n.i.2 |
| Belarus | n.i.2 | n.i.2 | 45 | 242,522 | 25 | 615,513 | 6 | 1,383,586 | 92 | 2,241,891 |
1 this category is not homogeneous and not comparable for different countries due to different definitions of Urban Wastewater Treatment Plants (UWWTPs) below 2000 PE and connected/generated loads
2 n.i.= no information
The wastewater treatment levels required by HELCOM Recommendation 28E/5 are 70% to 80% reduction for nitrogen and 90% reduction for phosphorus for cities above 10,000 inhabitants. For cities between 2,000 and 10,000 inhabitants, the reduction targets are 80% for phosphorus and 30% for nitrogen. To estimate the potential reductions that would be achieved by applying Recommendation 28E/5 in comparison to the present situation (2007-2009), several assumptions have been made because no detailed data were available. The nutrient removal percentage for the population connected to secondary treatment has been assumed to be 35% for both phosphorus and nitrogen, although it may in fact be higher in properly run MWWTPs. In addition, different removal targets according to the population of the municipalities were not applied. The basis of the calculation was the percentage of the total population connected to the wastewater treatment systems. In the case of phosphorus, the required level has already been achieved in Denmark, Finland, Germany, and Sweden.
There is also no nitrogen reduction potential for Denmark and Germany as they have already achieved the HELCOM Recommendation.
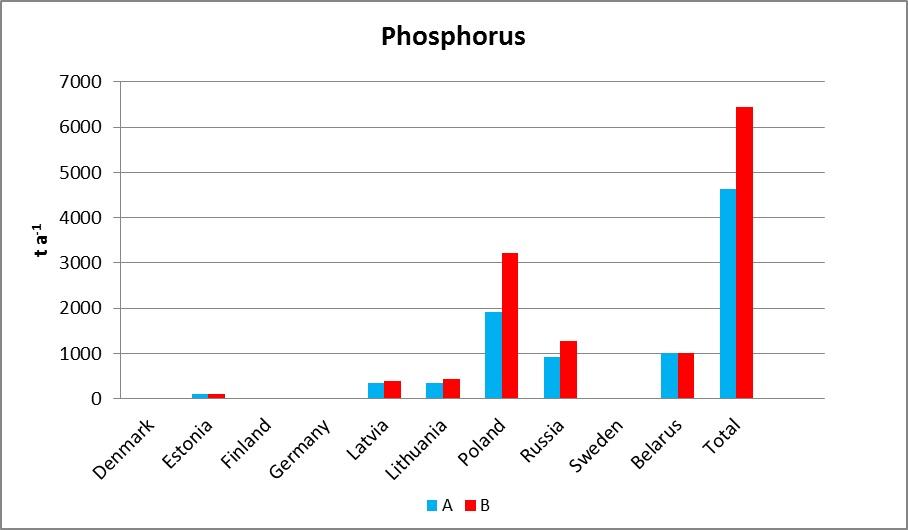
The reduction potential for phosphorus was calculated by using two different assumptions:
A: An upgrade of primary and secondary treatment to meet the 90% reduction target;
B: As A, but also plants with tertiary treatment are upgraded from 80% reduction (required by the EU UWWT Directive) to the level up to 90%.
The results (Figures 1 and 2) are given as estimated amounts ultimately discharged into the Baltic Sea after deducting the retention (net load). The retention in the catchment area was assumed to be 30% on average in inland surface waters of the whole catchment area for both nitrogen and phosphorus.