National nutrient input ceilings
Nutrient Input Ceilings (NIC) define maximum inputs via water and air to achieve good status with respect to eutrophication for Baltic Sea sub-basins for each country.
The progress towards national input ceilings is assessed every second year. The latest report assesses the progress towards nutrient input ceilings achieved by 2022.
These are the key results of the assessment of progress towards the nutrient input ceilings for total nitrogen and phosphorus inputs adopted by the Ministers in the updated HELCOM Baltic Sea Action Plan (BSAP 2021).
National targets for nitrogen and phosphorus inputs have been expressed as nutrient input ceilings for each country by sub-basin. Further nutrient input ceilings have been agreed for nine transboundary rivers. The evaluation is based on annual air- and waterborne nutrient input data from 1995-2022 country per basin and assessing estimated total nitrogen and phosphorus inputs in 2022 with the NICs from BSAP 2021.
Key messages
Fulfilment of nitrogen input ceilings by countries:
- Denmark is fulfilling nitrogen input ceilings for all HELCOM sub-basins. Denmark reduced total nitrogen inputs to all HELCOM sub-basins since the reference period with between 25% (Danish Straits) and 54% (Bothnian Bay).
- Estonia achieved the national input ceiling for Bothnian Bay, Bothnian Sea, Danish Straits and Kattegat. The remaining reductions for Baltic Proper, the Gulf of Finland, and the Gulf of Riga constitute 42%, 26% and 24%, respectively. Accounting for extra reduction in Bothnian Sea only contributes with 2 tons TN reduction in Baltic Proper reducing the missing reduction to 41%. Inputs since the reference period were reduced statistically significantly to four basins (Bothnian Bay, Bothnian Sea, Danish Straits and Kattegat, between 35% and 42%), and statistically significant increased to the Gulf of Riga (28%). No trend in inputs was assessed to Baltic Proper and Gulf of Finland.
- Finland is fulfilling nitrogen input ceilings for all HELCOM sub-basins. Input ceilings in Bothnian Bay is fulfilled by reallocation of the extra reduction in Bothnian Sea. Finland reduced total nitrogen inputs to all HELCOM sub-basins since the reference period with between 9% (Bothnian Sea) and 57% (Danish Straits).
- Germany is fulfilling nitrogen input ceilings for all HELCOM sub-basins. Input ceilings in Baltic Proper is fulfilled by reallocation of the extra reduction from the Gulf of Riga, Danish Straits and the Gulf of Finland. Germany reduced total nitrogen inputs to all HELCOM sub-basins since the reference period by between 23% (Baltic Proper and Danish Straits) and 42% (Bothnian, Bay, Bothnian Sea and Gulf of Finland).
- Latvia fulfils the input ceilings for Bothnian Bay, Bothnian Sea, Danish Straits and the Kattegat. The remaining reduction for the Gulf of Riga is 2.0% and is within statistical uncertainty. The remaining reductions for Baltic Proper and the Gulf of Finland constitute 108% and 11%, respectively. Accounting for extra reduction in Danish Straits only contributes with 1 tons TN reduction in Baltic Proper. Latvia decreased inputs to five sub-basins between 12% (Gulf of Finland) and 17% (Danish Straits) but has an 49% increase to Baltic Proper since the reference period, and no change in total nitrogen inputs to Gulf of Riga.
- Lithuania fulfils the input ceilings for Bothnian Bay, Bothnian Sea, Danish Straits and the Kattegat. The remaining reductions for Baltic Proper, the Gulf of Riga and the Gulf of Finland constitute 121%, 82% and 14%, respectively. Reallocation of extra reduction in Danish Straits is used to reduce the remaining reduction requirement in Baltic Proper with 2 tons. Lithuania decreased inputs to five sub-basins between 12% (Bothnian Sea and Gulf of Finland) and 14% (Bothnian Bay) but has an 63% increase in nitrogen inputs to Baltic Proper and 76 % to the Gulf of Riga, respectively since the reference period.
- Poland achieved the input ceiling for all sub-basins except for Baltic Proper, where the remaining reduction is 19%. Reallocation of the extra reduction from Danish Straits, Gulf of Finland and the Gulf of Riga reduced the reduction requirement with 520 tons of the remaining nearly 28,700 tons TN. Poland reduced total nitrogen inputs to all HELCOM sub-basins since the reference period by between 9% (Baltic Proper) and 32% (Bothnian Bay, Danish Straits and Kattegat).
- Russia fulfils input ceiling for all sub-basins except for Baltic Proper and the Gulf of Riga. The remaining reduction for Baltic Proper is 8.6% and is within statistical uncertainty. The remaining reductions for the Gulf of Finland 27%. Reallocation of the extra reduction from the Gulf of Riga and Danish Straits to the Baltic Proper reduce the missing reduction to 5.4%. Russia reduced total nitrogen inputs to all HELCOM sub-basins since the reference period by between 19% (Gulf of Riga) and 34% (Baltic Proper), except for Gulf of Finland where no changes in nitrogen inputs are assessed.
- Sweden achieved nitrogen input ceilings all HELCOM sub-basins except for Baltic Proper. The Input ceiling for Danish Straits is achieved by reallocating the extra reduction achieved in the Kattegat. Without the reallocation, status of fulfilment of NIC cannot be judged within statistical certainty. The remaining reduction for the Baltic Proper is 32%. The reallocation of the extra reduction achieved in the Gulf of Riga and the Gulf of Finland to Baltic Proper does not change the remaining reduction requirements in percentage. Sweden has significantly reduced total nitrogen inputs to five HELCOM sub-basins by between 22% (Kattegat) to 37% (Gulf of Finland) since the reference period, but no significant changes in nitrogen inputs have been assessed to Baltic Proper and Danish Straits.
- In general, Baltic Proper, the Gulf of Riga and the Gulf of Finland have the highest remaining reductions to achieve the ceilings for most countries.
- Waterborne transboundary nitrogen inputs from Belarus (30%) and Ukraine (100%) exceed corresponding input ceilings to Baltic Proper, while the exceedance from Czech Republic (10%) is within statistical uncertainty. Waterborne nitrogen inputs from Belarus to the Gulf of Riga fulfil the input ceiling. Ukraine is the only non-HELCOM country which has increased waterborne nitrogen inputs to Baltic Proper since the reference period (43%), while no trend is seen for Belarus and Czech Republic.
- Atmospheric nitrogen inputs from Baltic Sea shipping exceed their target values (NICs) to all sub-basins, the remaining reductions are between 44% (Kattegat) and 90% (Gulf of Riga). The inputs have been reduced to all sub-basins since the reference period by 25%.
- Atmospheric nitrogen inputs from North Sea shipping exceed their target values (NICs) to all sub-basins, the remaining reductions are between 59% (Kattegat) and 112% (Bothnian Bay). The inputs have been reduced to all sub-basins since the reference period by 26%.
- Other non-HELCOM countries and sources exceed respective target values (NICs) for inputs of atmospheric nitrogen to all sub-basins, the remaining reductions are between 12% (Danish Straits) and 25% (Bothnian Sea). The inputs have been reduced to all sub-basins since the reference period with between 38% (Gulf of Finland and Gulf of Riga) and 46% (Kattegat).
- The highest reductions (percentages) of total nitrogen inputs from HELCOM Contracting Parties are for the sub-basins to which countries only contribute with airborne inputs.
- Total inputs from all countries and sources decreased or did not increase significantly since the reference period except for Latvia, Lithuania, and Ukraine to Baltic Proper (49%, 63% and 43% increase, respectively), Estonia and Lithuania to the Gulf of Riga (28% and 76 % increase, respectively). There are no statistically significant changes in inputs for Belarus to Baltic Proper and Gulf of Riga, Estonia to Baltic Proper, Latvia to Gulf of Riga, Russia to Gulf of Finland, Sweden to Baltic Proper and to Danish Straits.
- Airborne inputs decreased since the reference period from all countries and sources.
- The highest reductions (percentages) of total nitrogen inputs from HELCOM Contracting Parties are for the sub-basins to which countries only contribute with airborne inputs..
- Waterborne inputs increased since the reference period particularly to Baltic Proper and the Gulf of Riga. To Baltic Proper from Germany (12%), Estonia (12%), Latvia (60%), Lithuania (67%), and Ukraine (43%). To Gulf of Riga: Estonia (21%), and Lithuania (81%). Further inputs from Estonia to Gulf of Finland increases (11%). There are no changes in waterborne inputs from Finland til Bothnian Bay, Belarus, Poland and Sweden to Baltic Proper, Finland and Russia to Gulf of Finland, Belarus, Latvia and Russia to the Gulf of Riga, Denmark. Germany and Sweden to Danish Straits and Denmark and Sweden to Kattegat.
- Recent trends in waterborne inputs indicate statistically significant increases also from Belarus to the Gulf of Riga, Denmark to Baltic Proper, Estonia to Gulf of Riga and Gulf of Finland, Germany and Latvia to Baltic Proper, Lithuania to Baltic Proper and Gulf og Riga, Sweden to Baltic Proper and Danish Straits.
- Compared with the NIC-2020 assessment eight country to sub-basins change status on fulfilling NIC when reallocating extra reduction in neighbouring sub-basins: Germany to Baltic Proper, and Lithuania to Bothnian Bay, Bothnian Sea and Kattegat change from not fulfilling NIC by 2020 to fulfil NIC by 2022 Finland to Bothnian Sea and Sweden to Danish Straits from it was not possible within statistical certainty to judge fulfilment of NIC by 2020 to fulfilment of NIC by 2022. Fulfilment of NIC from Finland to Gulf of Finland could not be judged within statistical certainty in NIC-2020 but NIC is fulfilled by NIC-2022. Russia did not fulfil NIC to Baltic Proper by 2020, but in 2022 fulfilment cannot be judged with statistical certainty.
Fulfilment of nitrogen input ceilings for transboundary rivers:
- Nitrogen nutrient ceilings are only fulfilled for Daugava. The remaining reduction for the remaining eight transboundary rivers with nutrient inputs ceilings are approx. 132% for Barta, 123% for Venta, 119% for Lielupe, 91% for Nemunas, 39% for Neva, 37% for Pregolya, 27% for Oder and 24% for Vistula.
- Waterborne nitrogen inputs increased significantly since the reference period in Barta (65%), Lielupe (96%), Nemunas (44%) and Venta (65%). For the remaining four rivers no trend in waterborne inputs is assessed.
- In recent year no trend is assessed for Daugava, and the trends are increasing markedly for four rivers: Barta (79%), Lielupe (130%), Nemunas (81%) and Venta (129%).
Fulfilment of phosphorus input ceilings by countries:
- None of the HELCOM countries fulfilled the input ceiling for phosphorus to all HELCOM sub-basins without reallocation of extra reduction. In relative terms, higher reduction remains to meet maximum allowable input (MAI) for phosphorus than for nitrogen (21% for phosphorus and 11% for nitrogen of MAI, respectively, HELCOM Core indicator 2022).
- All HELCOM and non-HELCOM countries exceeded input ceilings for the Baltic Proper without reallocation of extra reduction.
- No HELCOM Contracting Party increased their input of phosphorus since the reference period, but Ukraine increased its phosphorus inputs to Baltic Proper. All HELCOM Contracting Parties demonstrate significant decreases in phosphorus inputs.
- Denmark achieved reduction requirements for the Kattegat and Danish Straits. The input ceiling for the Baltic Proper is achieved by applying extra reduction from Danish Straits. Denmark reduced total phosphorus inputs to Danish Straits, the Kattegat and Baltic Proper by 35%, 23% and 22%, respectively.
- Estonia exceeded input ceilings to Baltic Proper, the Gulf of Finland and the Gulf of Riga. The remaining reductions for these sub-basins are 172%, 44% and 21%, respectively. Estonia reduced total phosphorus inputs to the Gulf of Finland, Gulf of Riga and Baltic Proper by 44%, 27% and 23%, respectively.
- Finland exceeded input ceilings to the Gulf of Finland but achieved it for Bothnian Bay and Bothnian Sea. The remaining reduction for the Gulf of Finland is 105%. After reallocation of the extra reduction from Bothnian Sea the missing reduction in Gulf of Finland is reduced to 99%. Finland reduced total phosphorus inputs to the Bothnian Bay, Gulf of Finland and Bothnian Sea by 20%, 19% and 14%, respectively.
- Germany meets the input ceiling for Danish Straits but has not achieved it for Baltic Proper where the remaining reduction is 109%. After reallocation of the extra reduction from Danish Straits to Baltic Proper the remaining reduction is reduced to 99%. Germany reduced total phosphorus inputs to the Baltic Proper and Danish Straits by 20% and 8%, respectively.
- Latvia exceeded input ceilings for both Baltic Proper and Gulf of Riga. The remaining reduction for Baltic Proper is 91%. The remaining reduction for the Gulf of Riga is 11% and is within statistical uncertainty. Latvia reduced total phosphorus inputs to Baltic Proper and to the Gulf of Riga with 35% and 38%, respectively.
- Lithuania fulfilled the input ceiling for the Gulf of Riga but exceeded it for Baltic Proper where the remaining reduction is 53%. Reallocation of extra reduction achieved by Lithuania in the Gulf of Riga reduce remaining reduction to the Baltic Proper to 47%. Lithuania reduced total phosphorus inputs to the Gulf of Riga and Baltic Proper by 72% and 45%, respectively.
- Poland exceeded the input ceiling for Baltic Proper, and the remaining reduction is 97%. Poland reduced total phosphorus inputs to Baltic Proper by 28%.
- Russia exceeded input ceilings for Baltic Proper, the Gulf of Finland and the Gulf of Riga. The remaining reductions for these sub-basins constitute 123%, 34% and 16%, respectively. Russia reduced total phosphorus inputs to the Gulf of Finland, Baltic Proper and the Gulf of Riga by 53%, 41% and 29%, respectively.
- Sweden achieved input ceilings for Bothnian Bay (extra reduction being zero), Bothnian Sea, Danish Straits and the Kattegat. The remaining reduction for the Baltic Proper is 113%. By reallocation of extra reduction from Bothnian Sea and Danish Straits to Baltic Proper the remaining reduction needs are reduced to 35%. Sweden reduced total phosphorus inputs to Bothnian Sea, Baltic Proper, Danish Straits and Kattegat by 40%, 20%, 16% and 12%, respectively.
- Non-HELCOM countries Belarus, Czech Republic, and Ukraine exceeded reduction requirements for the Baltic Proper with 144%, 104% and 216%, respectively, and Belarus to the Gulf of Riga with 58%.
- All countries fulfilled national ceilings for total phosphorus inputs to Bothnian Bay, Bothnian Sea, Danish Straits and the Kattegat.
- There are no recent trends (since last break point) in phosphorus inputs from Belarus, Denmark, Estonia, Latvia and Lithuania to Baltic Proper, from Estonia and Russia to the Gulf of Finland, from Belarus, Lithuania to the Gulf of Riga, from Germany and Sweden to Danish Straits, and from Sweden to Kattegat.
- The remaining reduction requirement is for most sub-basins lower by 2022 compared to 2020, but for Estonia to Baltic Proper and Gulf of Finland and Latvia to Baltic Proper it is higher.
- Compared with the 2020 NIC assessment three country to sub-basins change status on fulfilling NIC: Finland to Bothnian Sea not fulfilling NIC by 2020 to fulfil NIC by 2022; Latvia to the Gulf of Riga from not achieving NIC by 2020 to it is not possible within statistical certainty to judge fulfilment NIC by 2022; and Sweden to Bothnian Bay from it was not possible within statistical certainty to judge fulfilment by 2020 within using reallocation of extra reduction in Bothnian Sea to achieving NIC by 2022 with use of reallocation.
Fulfilment of phosphorus input ceilings for transboundary rivers:
- Phosphorus nutrient ceilings are not fulfilled for eight transboundary rivers with input ceilings. The remaining reduction for Lielupe is less than 1% but within statistical uncertainty. The remaining reduction is 209% for Pregolya, 122% for Vistula, 111% for Venta, 96% for Neva, 88% for Oder, 79% for Nemunas, 58% for Barta and 44% for Daugava.
- Waterborne phosphorus decreased significantly since the reference period in Barta (52%), Lielupe (47%), Nemunas (36%), Neva (31%), Oder (30%), Venta (25%) and Vistual (25%). No trend is found for Daugava and Pregolya.
- Only Lielupe (35%) and Vistula (29%) have significant recent decreasing phosphorus inputs, the remaining rivers have no recent trends
The time series (1995-2022) of nitrogen and phosphorus inputs have been reviewed and for some countries some updates has been performed since latest NIC assessment based on 1995-2020 data. Further, EMEP has recalculated the annual atmospheric nitrogen deposition on sub-basins, which led to revised and a bit higher deposition compared to the NIC2020 assessments.
Nutrient Input Ceilings (NICs) agreed in the BSAP 2021 updated were used for the current assessment but taking into account revised shares of nitrogen and phosphorus inputs for Oder River between Germany and Poland that were agreed in 2022, changing NIC to Baltic Proper for Germany and Poland compared with the corresponding NICs in the BSAP 2021 update.
Table 1.
Total Nitrogen. Evaluation of input ceilings fulfilment by 2022 taking into account reallocation of extra reduction.
Based on statistically estimated inputs (scroll down for full legend)
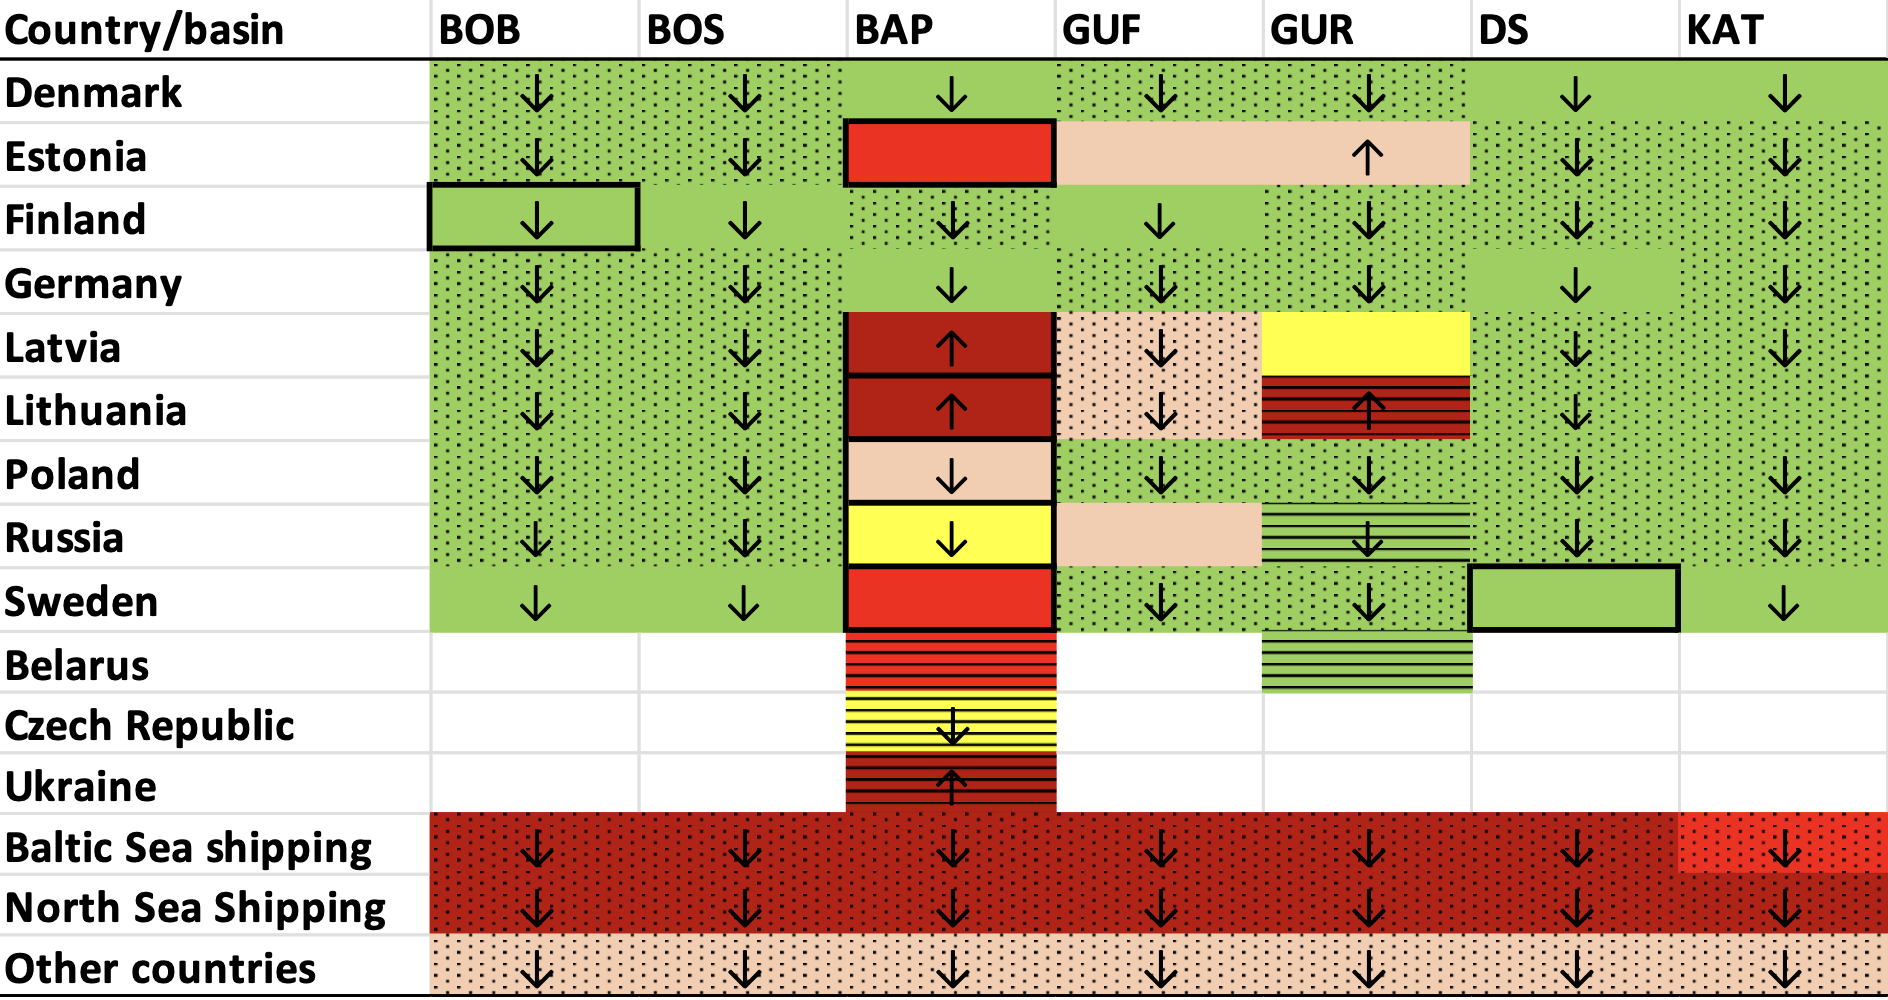
Table 2.
Total Phosphorus. Evaluation of input ceilings fulfilment by 2022 taking into account reallocation of extra reduction.
Based on statistically estimated inputs (scroll down for full legend)
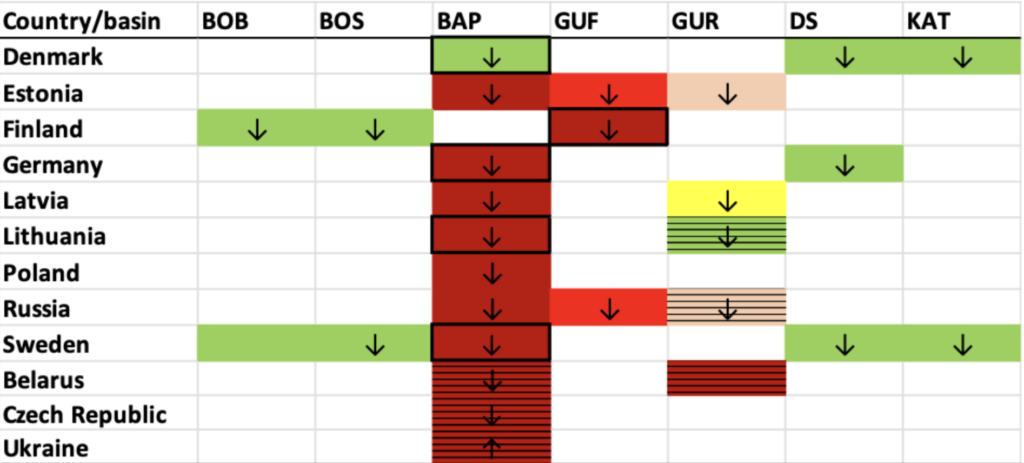
Table 3.
Total Nitrogen and total Phosphorus. Evaluation of input ceilings fulfilment for nine transboundary rivers by 2022

Legend
Reduction still left to fulfil NIC is:
![]() – Less than 10%
– Less than 10%![]() – Between 10 and 30%
– Between 10 and 30%![]() – Between 30% and 50%
– Between 30% and 50%![]() – 50% or more
– 50% or more
![]() – Within statistical certainty, the fulfilment of NIC cannot be justified
– Within statistical certainty, the fulfilment of NIC cannot be justified![]() – NIC is with 95 % statistical certainty fulfilled; inputs ceiling not exceeded
– NIC is with 95 % statistical certainty fulfilled; inputs ceiling not exceeded![]() – Classification is not relevant
– Classification is not relevant
![]() – Only airborne inputs to the sub-basin
– Only airborne inputs to the sub-basin![]() – Only transboundary waterborne inputs to the sub-basin
– Only transboundary waterborne inputs to the sub-basin![]() – Application of extra reduction achieved in neighbouring basins changed status
– Application of extra reduction achieved in neighbouring basins changed status
Arrows: Statistically significant changes of nutrient inputs from the reference period (1997-2003) to 2022, taking into account 95% confidence interval for both latest inputs and reference values.
![]() – Significant decrease
– Significant decrease![]() – Significant increase
– Significant increase
Remaining reduction (in %) is calculated as: (remaining reduction in tons/ NIC in tons) * 100%
“Other countries” includes sources for atmospheric nitrogen deposition of the EU countries not being HELCOM Contracting Parties, countries outside EU including Belarus, Ukraine etc.
BSS = nitrogen deposition from Baltic Sea Shipping
NOS = nitrogen deposition from North Sea Shipping
Basins:
- BOB = Bothnian Bay
- BOS = Bothnian Sea
- BAP = Baltic Proper
- GUF = Gulf of Finland
- GUR = Gulf of Riga
- DS = Danish Straits
- KAT = Kattegat
Authors
Lars M. Svendsen1, Søren Erik Larsen1 and Bo Gustafsson2
1) DCE, Danish Center for Environment and Energy, Aarhus University
2) BNI, Baltic Nest Institute, Stockholm University